Greenhouse Gas Management
To enhance the accuracy of GHG emissions measurement, SYSTEX introduced the GHG Inventory in 2021 and conducts it annually in accordance with ISO 14064-1:2018 guidelines to develop improvement plans. The “GHG Inventory Committee” oversees data audits following the “Internal Audit Management Procedures,” with an independent 3rd party conducting external verification. SYSTEX’s GHG inventory boundary covers its headquarters.
In 2024, the market-based GHG emissions of the SYSTEX headquarters building totaled 3,265.46 tCO2e, of which the electricity consumption accounted for the highest proportion of emissions, reaching 79.1%, highlighting energy management as a key reduction measure.
SYSTEX conducts Headquarters GHG inventory of category 1-6, using the parameters released by the IPCC AR6, Ministry of Environment, or relevant authorities. The inventory covers:
- Category 1: Direct GHG emissions
SYSTEX quantifies emission resources owned or controlled of its headquarters building, including the sources of stationary combustion, mobile combustion and fugitive.
- Category 2–6: Indirect GHG emissions
The GHG Inventory Committee reviewed all category 2-6 emission sources according to the guidelines of “ISO 14064-1: 2018,” and defined those emissions with a score over 30 as significant.
Category 2 emissions are generated by imported energy.
Category 3-4 emissions include business travel, the indirect carbon footprint of electricity, and disposal of waste, as identified as significant.
- Emission Factor
SYSTEX conducts GHG inventory using parameters released from IPCC AR6, the Ministry of Environment, and other relevant authorities.
2024 Greenhouse Gas Emissions
GHG Emissions (Category 1-6) [Boundary: SYSTEX headquarters building]
| Category | Emission sources | Emissions (tCO2e) | 2020 base year [Compare to 2020] |
||
| Subtotal | Total | ||||
| Category 1: Direct GHG emissions | From stationary combustion | 0.0000 | 52.3156 | 13.7720 [279.9%] |
|
| From mobile combustion | 3.2223 | ||||
| From anthropogenic systems | 49.0933 | ||||
| Category 2: Indirect GHG emissions | From imported electricity | Location-based [Market-based] | 2,581.8415 [2,581.8415] |
2,897.2684 [-10.9%] |
|
| Category 3: Indirect GHG emissions | From transportation | By THSRC | 5.2754 | 88.8548 | 698.0680 [-9.6%] |
| By airplanes | 47.7560 | ||||
| By taxi | 35.8234 | ||||
| Category 4: Indirect GHG emissions from products used by organization | From the production of electricity purchased | Indirect carbon footprint of electricity | 529.9856 | 542.4481 | |
| Indirect carbon footprint of Solar PV | 2.4986 | ||||
| From disposal of general waste | 9.9639 | ||||
| Category 5: Indirect GHG emissions | From the products’ usage | No significant emissions | |||
| Category 6: Indirect GHG emissions | from other sources | No significant emissions | |||
| Total Emission (Category 1-6) (Location-based [Market-based] ) | 3,265.4600 [3,265.4600] | 3,558.2083 [-9.5%] |
|||
Note: Scope 1 corresponds to category 1, Scope 2 to category 2, Scope 3 to category 3-6. Due to the changes in the emission coefficient factor, Category 1 emissions have increased compare to the base year.
Direct GHG Emissions (Category 1) [Boundary: SYSTEX headquarters building]
| Item | CO2 | CH4 | N2O | HFCs | PFCs | SF6 | NF3 | Total emission | Biogenic emission |
| GHG emissions (tCO2e) | 3.0824 | 0.0307 | 0.1092 | 49.0933 | 0.0000 | 0.0000 | 0.0000 | 52.3156 | 0.0000 |
| Proportion | 5.89% | 0.06% | 0.21% | 93.84% | 0.00% | 0.00% | 0.00% | 100.00% | – |
Note: Due to the changes in the emission coefficient factor, Category 1 emissions have increased compare to the base year.
Greenhouse Gas Management Performance
Through the ISO 14064-1 GHG inventory, SYSTEX found that purchased electricity produced the highest proportion of emissions. Therefore, in addition to implementing various environmental and energy management measures, SYSTEX purchases and rents equipment with environmentally-friendly labels, replaces power-consuming equipment every year, regularly checks pipelines, and sets the office temperature to no less than 26°C. In addition, SYSTEX also supports RE development, signing a RE Wheeling Contract in 2022 to use renewable energy by 120,000 kWh annually since 2023. SYSTEX has also planned and launched an “Internal carbon pricing mechanism” in 2024, imposing carbon fees to enhance wheeling renewable energy usage, resulting in an renewable energy usage increase by 140,000 kWh, thereby amplifying the decarbonization impacts.
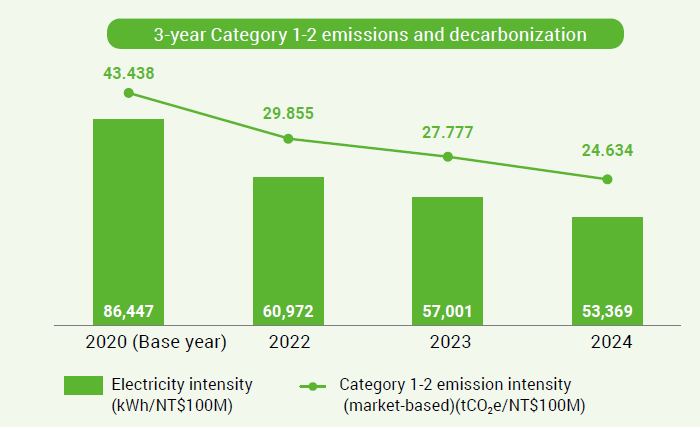
3-year GHG Emissions of Category 1-2 [Boundary: SYSTEX headquarters building]
Despite business expansion in 2024, SYSTEX reduced electricity consumption by 1.8% annually through active energy-saving measures. Over the past 3 years, electricity intensity has steadily decreased, reflecting improved energy efficiency. To mitigate emissions from future growth, SYSTEX has launched an internal carbon pricing mechanism in 2024 to increase RE share and minimize negative impacts.
| Item | 2020 base year | 2021 | 2022 | 2023 | 2024 |
| Category 1 GHG emissions (tCO2e) | 13.7720 | 7.2465 | 11.0019 | 20.4516 | 52.3156 |
| Category 2 | |||||
|
5,692,079 | 5,536,879 | 5,665,093 | 5,810,192 | 5,706,923 |
|
100,000 | 72,000 | 83,493 | 120,000 | 260,000 |
|
2,897.2682 | 2,779.5135 | 2,804.2210 | 2,810.9551 | 2,581.8415 |
|
2,846.3684 | 2,743.3695 | 2,762.8922 | 2,810.9551 | 2,581.8415 |
| Category 1-2 GHG emissions (tCO2e) | |||||
|
2,911.0400 | 2,786.7600 | 2,815.2229 | 2,831.4067 | 2,634.1571 |
|
2,860.1404 | 2,750.6160 | 2,773.8941 | 2,831.4067 | 2,634.1571 |
| Consolidated revenue (NT$100M) | 237.35 | 295.27 | 331.29 | 351.84 | 389.58 |
| Annual electricity intensity (kWh/NT$100M) | 86,447 | 72,938 | 60,972 | 57,001 | 53,369 |
| Annual Category 1-2 emission intensity (tCO2e/NT$100M) | |||||
|
44.211 | 36.710 | 29.855 | 27.777 | 24.634 |
|
43.438 | 36.234 | 29.855 | 27.777 | 24.634 |
Note: Electricity intensity and emission intensity are estimated within the boundary of SYSTEX Group, including overseas regions.
Greenhouse gas emission data in the past 4 years have been audited by SGS (2022-2025)
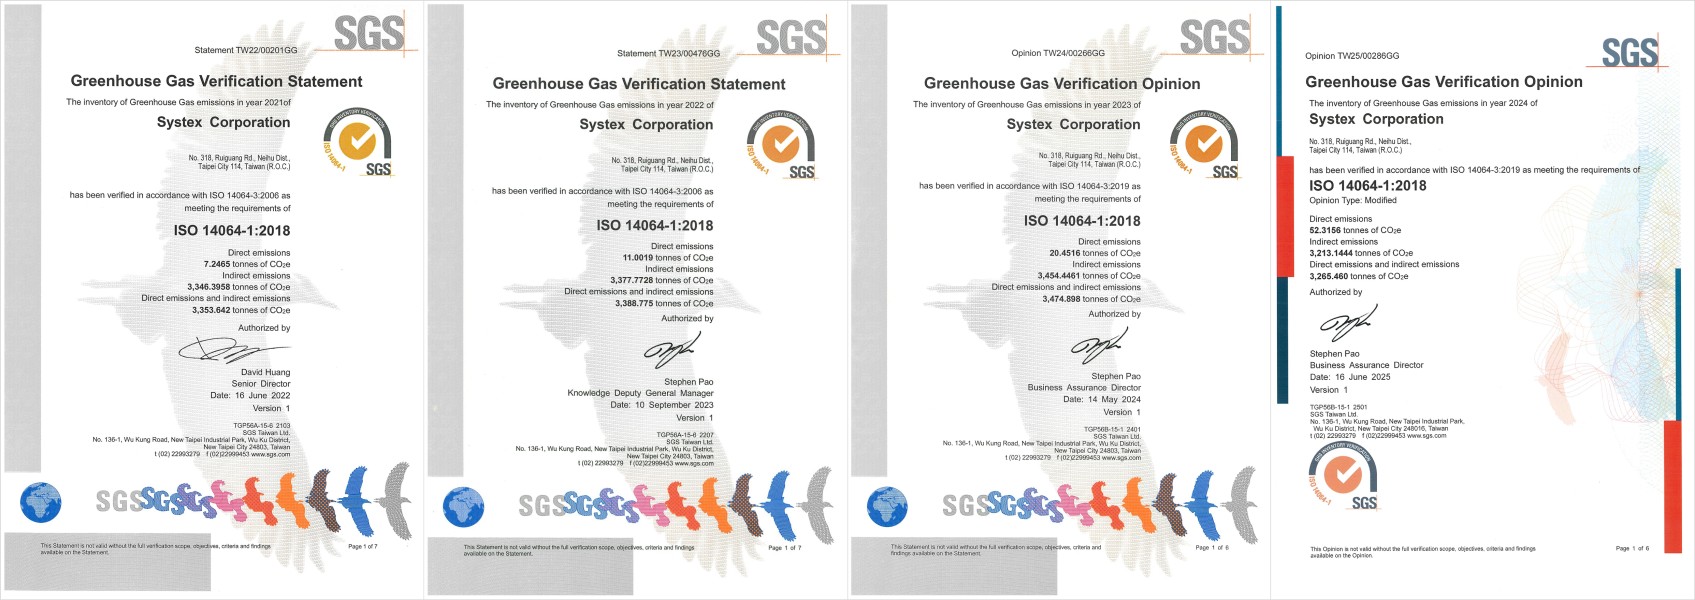
- ISO 14064-1 GHG Verification Statement (2022/06/16)
- ISO 14064-1 GHG Verification Statement (2023/09/10)
- ISO 14064-1 GHG Verification Statement (2024/05/14)
- ISO 14064-1 GHG Verification Statement (2025/06/16)